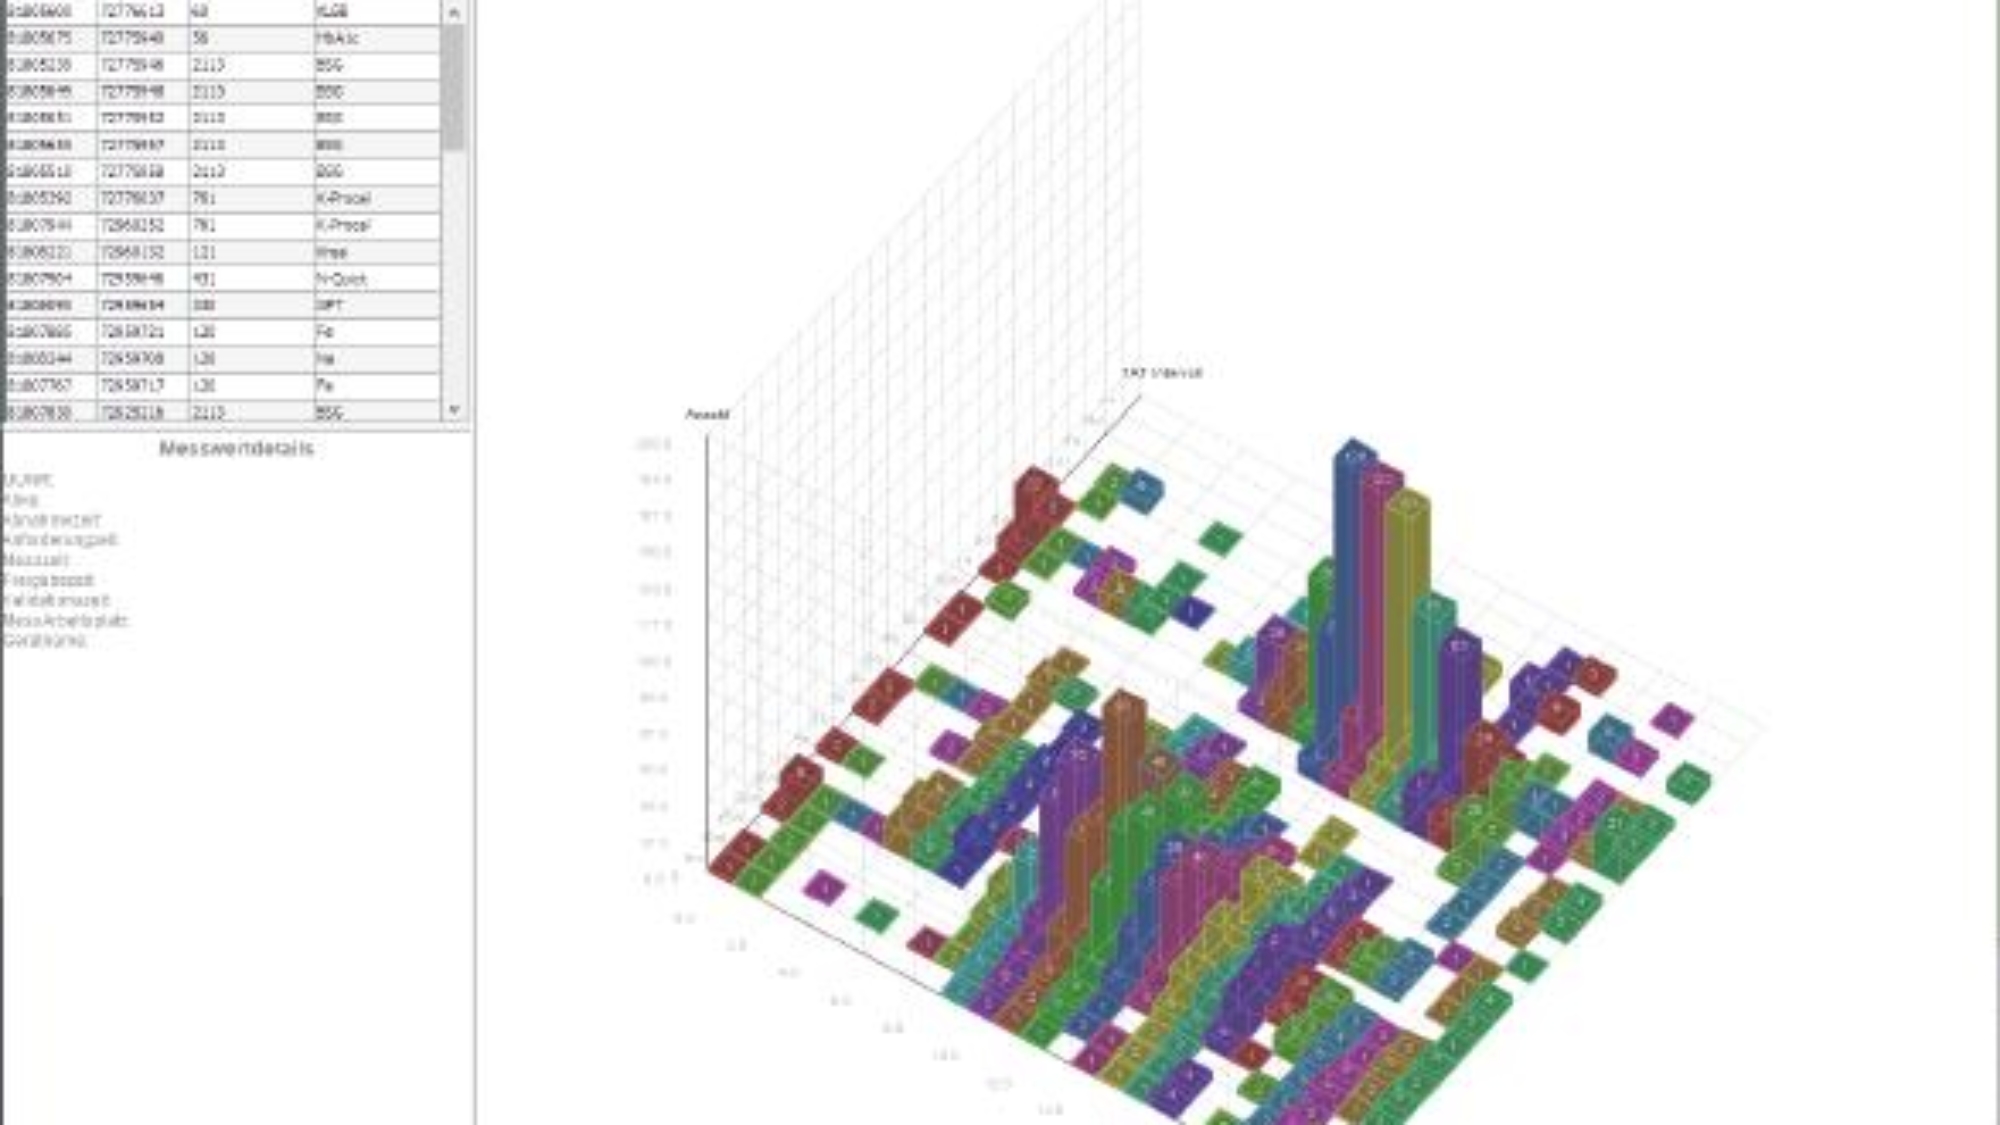
The module “Turnaround Time” (TAT) is intended to support our users with questions about the reaction and processing speed of their laboratory. “Turnaround time” means the time that elapses between the transition from state “A” to the next “B”. What these states are is determined by the options available. By default, the time in the TAT module is determined from the time the order is received to the technical release of the measured value.
All evaluations of the TAT module can be achieved with the module QuickStat – and far beyond. With the TAT module, everyday question and filter settings should be answered in a short time with little effort. The visualization of the data for the user completes the task of the TAT module. By means of a column landscape with navigation options that can be rotated in all three axes for closer inspection, we would like to directly support the path from the overview to the detail.
Individual orders as well as a set of orders to be defined via the settings can be used for analysis. For example, an analysis of the TAT of a clinic sender representative for a week with regard to the emergency parameters. Each order should only be counted once and sorted under the longest TAT of the participating measured values.
A “click” on a column of the displayed graphic shows the list of orders and measured values. For such an order, an individual evaluation of the order can now be started with an individual assessment of the TAT for each analyte.
The time and evaluation criteria can be adjusted as required.
The module is based on a CSV matrix of the counting data, the axes of which are typically the time of arrival of the sample as hour (x), the TAT intervals in minutes (y) and the number (z) at the intersection. This matrix is automatically displayed as a 3D bar landscape and can be moved across all three axes. In this way, even if the column landscape is difficult to understand, all details can be viewed.
Evaluations can be saved locally if the result of the evaluation is to be retained. The boundary conditions of the query are stored in the CSV tables as commented text. In order to come back to a casually produced evaluation, there are usually four weeks. After that, the data about the self-administration of the system are deleted. The queries that arise in everyday life are too numerous and the reason is usually of no great importance that the elimination of the data products appears necessary for reasons of system maintenance after such a period.


